
A Google Maps grid audit checks where a business appears for a specific search across multiple geographic locations. Unlike a single ranking check, it reveals whether visibility extends beyond the business address into the neighborhoods it wants to serve. The useful result is a repeatable baseline—not merely a colorful screenshot: the same business, keyword, grid, radius and measurement method, documented well enough to support an honest recommendation.
Measurement guidance, not a claim of ranking gains or a customer case study.ProfitMaps AI — Launch Approaching
$37 advertised Basic entry. Evaluate a connected Maps audit and proposal workflow against your actual client needs.
Advertised release: October 21, 2026, 11:00 AM EDT. Basic is listed at $37; final billing, scan credits, exports and refund terms require live checkout confirmation. No launch coupon is verified.
Check ProfitMaps AI Launch Availability →Why Single-Pin Rankings Can Mislead Business Owners
A business owner searches from the office, sees the company near the top and assumes local SEO is working everywhere. That conclusion skips the location of the searcher.
Google identifies relevance, distance and prominence as important local ranking factors. A result observed near the business does not establish the same visibility several neighborhoods away. See Google's local ranking explanation.
Proximity is not a simple formula where every additional mile produces a predictable decline. Competitors, query relevance and other factors can change the pattern. A grid asks a narrower question: Where does this listing appear for this service, under these settings? It cannot independently tell you how many customers were lost or what revenue an SEO campaign will generate.
How Local Geo-Grids Work
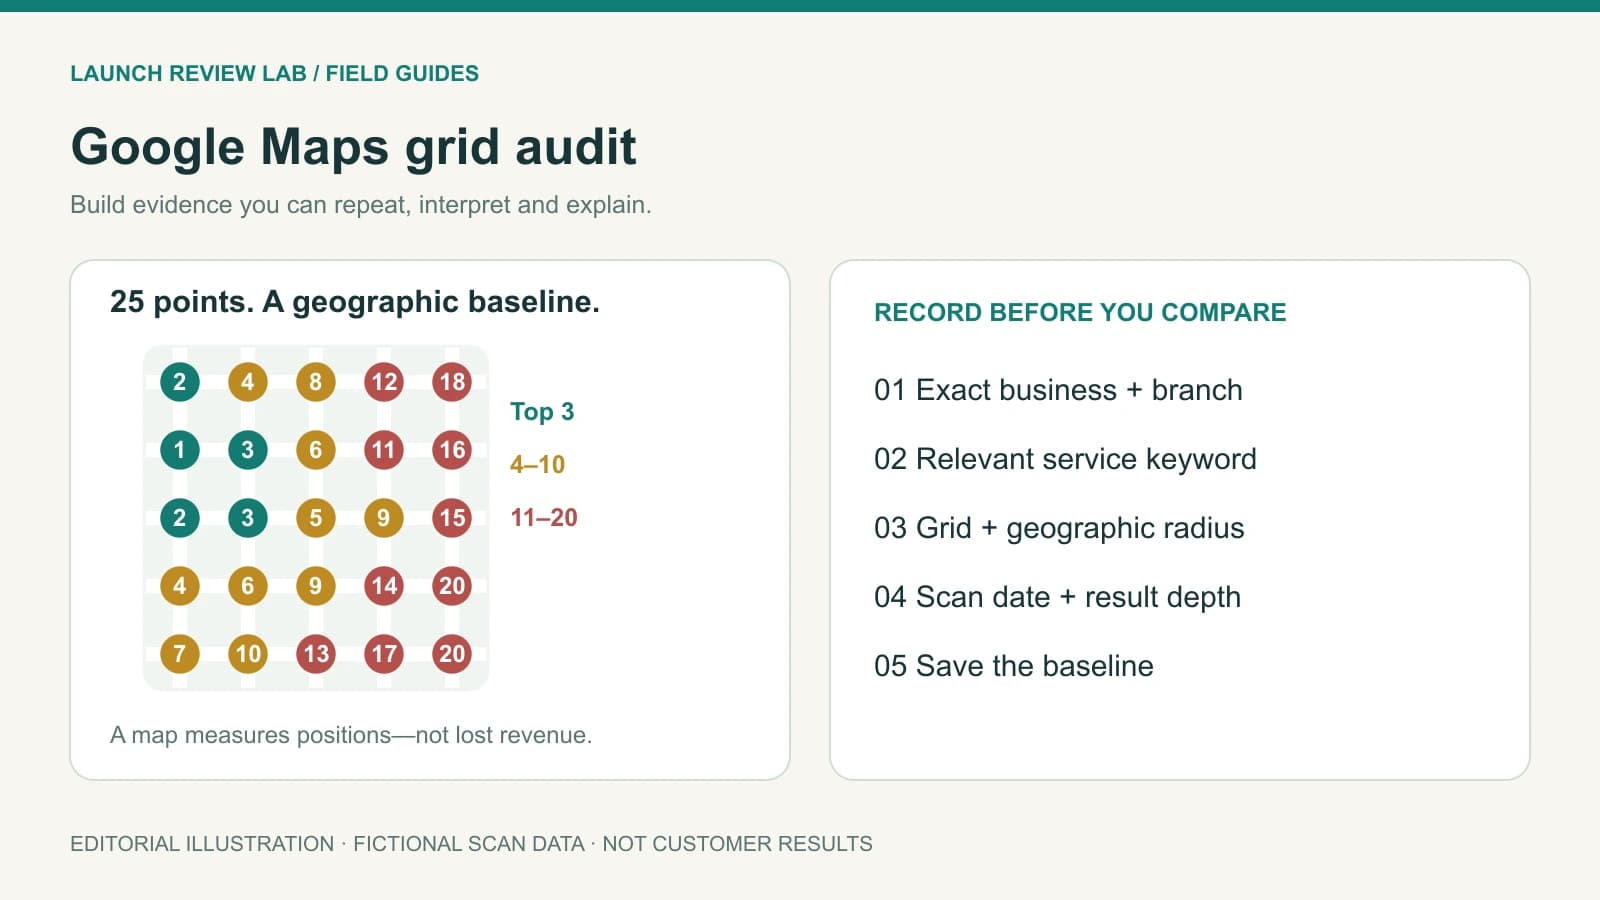
A geo-grid samples search results from a set of locations around a selected center. A 5 × 5 grid contains 25 points; each represents a location from which the tool checks the chosen query. Record the settings below before interpreting the colors.
| Setting | Record | Why It Matters |
|---|---|---|
| Business | Exact listing and branch | Avoid measuring a duplicate or the wrong location |
| Keyword | Exact service query | Different services produce different competitive conditions |
| Grid | Rows, columns and point spacing | Defines the geographic sampling density |
| Radius | Extent and center | Establishes which neighborhoods are sampled |
| Scan context | Date, tool, result type and depth | Makes later comparisons more meaningful |
Check how the tool defines radius: distance to an edge, corner or another boundary. Two tools may not use identical geometry even when their screens show the same number.
Read the Legend Before Reading the Map
Green might represent a top-three result. Red might mean a lower position. “Not found” may mean absent within the tool's checked result depth—not absent from Google altogether. Record the depth and legend alongside the screenshot.
Keep the Result Type Consistent
Maps results, the local pack and ordinary organic results are not interchangeable. Document what the tool measured before discussing an average or presenting a before-and-after comparison.
The Six-Step Google Maps Grid Audit
Step 1: Confirm the Business Identity
Check the listing name, relevant branch, website and address or service-area context. Create separate baselines for separate branches; do not merge them into one ranking score. Use public information for initial research and obtain authorization before making profile changes.
Step 2: Choose Queries That Match Real Services
Start with a service the business genuinely provides. “Air conditioning repair” and “commercial HVAC installation” describe different customers and competitors. Choose a primary service, a relevant secondary service and a location-qualified variation where appropriate. Do not select only queries that make the map look dramatic.
Step 3: Set a Defensible Geographic Area
Match the area to the business's actual market. A neighborhood dentist and an emergency plumbing company may require different coverage. A metropolitan scan can exaggerate weakness if the business does not realistically serve all of it. Keep the settings visible.
Step 4: Run the Scan and Inspect Anomalies
Review unexpected points rather than treating automation as unquestionable. Check listing mismatches, unusual competitors, missing results and boundaries where the query becomes less relevant. Manual spot-checks help investigate, but a browser search is not automatically an identical measurement environment.
Step 5: Summarize Coverage Without Inventing Demand
If a listing appears in the top three at five of 25 sampled points, its top-three point coverage is 5 ÷ 25 × 100 = 20%. That describes the grid—not market share, customer coverage or lost revenue. Report top-three point coverage, weak clusters and whether results are within the checked depth. Do not silently treat missing ranks as precise positions in an average.
Step 6: Establish a Repeatable Baseline
Save the settings, date, report and interpretation. Reuse the configuration for follow-up local SEO rank tracking. If you change it, explain why and avoid presenting the new scan as a directly comparable improvement. A measurement log is more useful than unexplained screenshots.
Manual Checks Versus Automated Grid Visualization
Manual research helps you understand a neighborhood and investigate suspicious points. It becomes cumbersome when many locations need consistent measurement and documentation.
- One browser search: A quick observation, not evidence of service-area coverage.
- Repeated manual checks: Useful for selected locations, but difficult to standardize.
- Automated geo-grid: Repeatable sampling with configuration, data-quality and usage constraints.
- Grid plus manual review: A more defensible client interpretation, still requiring judgment.
Automation reduces collection and presentation work. It does not validate the business, query or conclusions for you.
Turn Visibility Gaps Into a Credible Client Proposal
A useful proposal connects an observation to a realistic next step. Avoid “You are invisible, and we can put you first.” Instead, explain what the selected scan actually showed:
In this scan, your listing appears in the top three near the business but less consistently in the western part of the service area. We recommend reviewing the profile, relevant website pages and competing listings before prioritizing the work.
Present four things: measurement, observation, investigation and service. Name the business, query and area; describe stronger and weaker clusters; identify the checks still needed; then scope work you can perform. Ranking evidence supports a conversation, not a guaranteed retainer or proof of the cause of every weak point.
For package design and outreach examples, continue to the local SEO retainer playbook.
Where ProfitMaps AI Fits
ProfitMaps AI's vendor materials demonstrate a connected scan, report and planning workflow. Its attraction is practical: bringing geographic observations and client-facing presentation together. Advertised release: October 21, 2026, 11:00 AM EDT. Basic is listed at $37; final billing, scan credits, exports and refund terms require live checkout confirmation. No launch coupon is verified.
We do not treat “a complete audit in 60 seconds” as a verified performance benchmark. Completion depends on the setup and service response; a useful audit also requires interpretation.
For product-specific limits, read our in-depth ProfitMaps AI review. The dedicated ProfitMaps AI guide on profitmapsai.net provides another view of the scan-to-proposal setup.
If ongoing monitoring is your main requirement, compare ProfitMaps AI with Local Falcon before selecting a tool.
Your Audit Quality Checklist
Before sharing a local heatmap ranking report, confirm these points:
- The business and branch are correct.
- The query matches a service customers can actually purchase.
- The grid covers a relevant market.
- The radius, date and result depth are disclosed.
- Missing results are distinguished from exact positions.
- Observations are separated from revenue assumptions.
- Recommendations match services you can fulfill.
A defensible audit is easier to explain, repeat and use in a client relationship than a dramatic screenshot without context.
Choose a Tool After Defining the Audit
Start with one legitimate business, one relevant query and a saved configuration. Check whether the software's real usage costs and exports fit that task. If ProfitMaps AI's connected workflow matches your needs, use the launch link to check availability and the final terms—not as confirmation that the cart is already open.
Check ProfitMaps AI Launch Availability →Frequently Asked Questions
What is a Google Maps grid audit?
It checks a business's position for one query from multiple geographic points. This reveals differences in sampled local visibility rather than relying on one search near the business.
How often should I check GBP rankings?
Choose a cadence that fits the campaign, budget and decisions you need to make. Keep the configuration consistent and avoid treating a small movement in one scan as proof that a specific change succeeded or failed.
Does a red heatmap prove that a business is losing customers?
No. It indicates weaker sampled visibility under the tool's settings, not measured lost sales. Revenue analysis requires additional evidence such as qualified inquiries, conversion tracking and customer behavior.
Does ProfitMaps AI fix the rankings it identifies?
The demonstrated workflow supports diagnosis, reports and planning. Profile changes, website improvements and other implementation remain separate work; a scan cannot guarantee ranking outcomes.