
Quick answer: “Proximity decay” describes the way local visibility can weaken as the search location moves away from a business. It is not a published Google formula, and a red grid edge is not automatically a penalty. Diagnose the pattern with a fixed listing, useful search terms and comparable coordinates before changing the profile or selling a remedy.
The Vanity Ranking Trap: One Search Is Not a Service-Area Audit
An owner searches for a service from the office, sees the business near the top and concludes that local visibility is healthy. A prospective customer searches from another neighbourhood and sees competitors instead. Both observations may be genuine; they answer different location-specific questions.
Office Wi-Fi is not a ranking switch. The issue is treating one search location, device and query as a reliable sample of an entire market. Incognito mode does not remove geography either.
There is also an important distinction between spatial weakness and a temporal ranking drop. A business that has always been weak two miles away has a coverage problem. A business that fell at the same coordinates under comparable settings may have changed over time. Do not claim a drop without a usable baseline.
Our full ProfitMaps AI review explains its documented diagnostic workflow. Here, the focus is interpreting a geographic pattern and deciding what evidence you need next—not repeating a generic software walkthrough.
Distance Matters, but “Proximity Decay” Is Not a Diagnosis by Itself
Google's local-ranking guidance describes relevance, distance and prominence as the main factors. It does not publish a fixed distance-to-ranking equation or a guaranteed radius within which a listing should win.
A nearby relevant competitor may outperform you, while a more established or better-matched business can sometimes appear farther from its address. Therefore, avoid presenting visibility as a perfect circle that shrinks at a predictable rate.
What About the Vicinity Update?
“Vicinity” is commonly used in local SEO discussions about proximity and local-result changes. That label does not explain every weak pin in a 2026 report. This guide does not claim a newly verified 2026 Vicinity update, a secret distance multiplier or a tool that overrides Google's location signals.
The useful questions are more specific: Is the right listing being measured? Is the query commercially relevant? Does the same competitor dominate the weak area? Are you comparing the same coverage and time window? Investigate those before blaming an algorithm update.
Build a Diagnosis Brief Before Running a Scan
Write down the business decision you want to support. “Improve local SEO” is too vague. “Check whether our emergency plumbing visibility reaches the residential area east of the office” is testable.
Record the following:
| Field | What to record | Why it matters |
|---|---|---|
| Business identity | Correct listing and actual business location | Prevents scanning a duplicate or similarly named competitor |
| Query | Exact service phrase and language | Different services can produce different competitive patterns |
| Geography | Centre, radius or spacing, units and intended coverage | Defines what an edge pin actually represents |
| Sampling | Grid dimensions and any excluded coordinates | Makes later comparisons interpretable |
| Timing | Date, approximate time and relevant business-hour context | Separates geography from changing search conditions |
| Commercial purpose | Target neighbourhood and real service capacity | Prevents chasing rankings where the business cannot fulfil demand |
Choose queries because customers use them, not because the first scan looks greener. A branded business-name query can be a useful identity check, but it is not a substitute for measuring discovery searches.
For a broader process checklist, use our complete Google Maps grid audit framework.
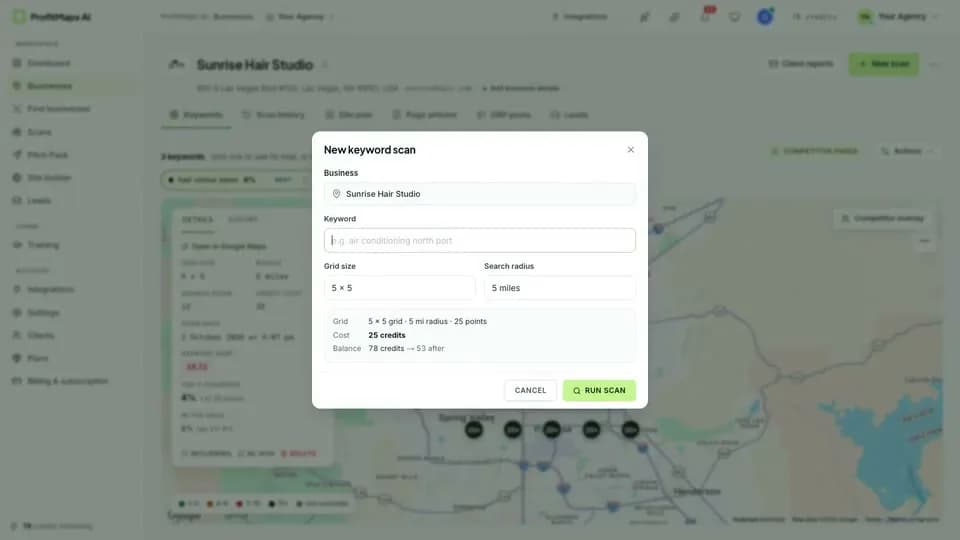
Step 1: Choose Coverage Before Choosing 5×5 or 7×7
Grid size and geographic coverage are different controls. At fixed coverage, more points provide denser sampling. At fixed point spacing, more points expand the area. Establish which behaviour the tool uses before comparing two reports.
The current ProfitMaps vendor page lists 5×5 for Basic and 9×9 for Pro and bundles. A 7×7 option is not established by the inspected documentation. If you require that precise configuration, confirm it in the actual interface rather than assuming every tracker offers the same selector.
As general geometry, 5×5 samples 25 positions, 7×7 samples 49 and 9×9 samples 81. Those counts are not a promise of identical credit consumption across products. Review the displayed charge before each job and confirm what your purchased plan includes.
Avoid changing the radius repeatedly until the map looks impressive. Start with the area the business actually serves, document that choice and accept that the result may reveal a competitive boundary.
Step 2: Read the Pattern, Not Just the Colours
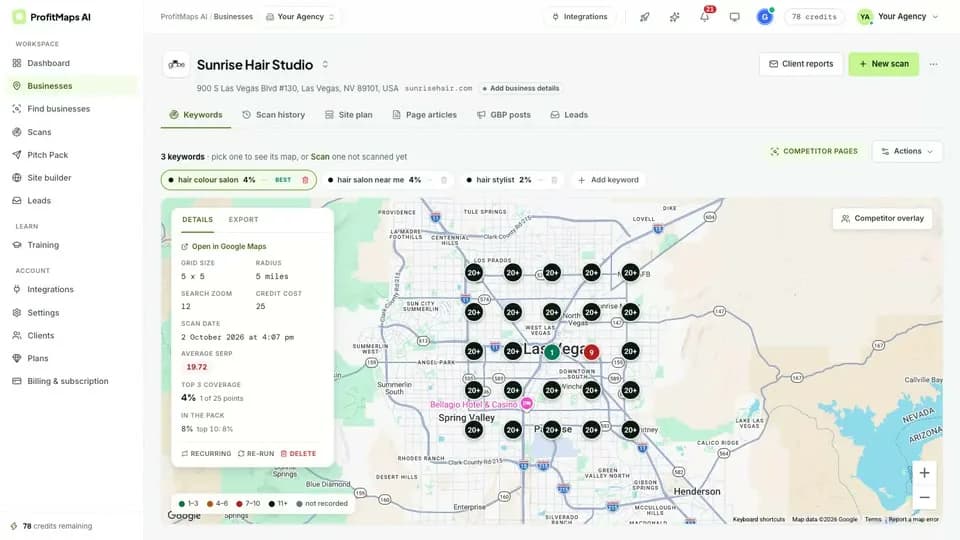
A red or yellow point is an observation under the report's legend. It does not identify a cause. Check the numerical rank, the result threshold and how the tool represents a listing that was not found.
The following are hypothetical interpretation examples, not ProfitMaps customer results:
| Observed pattern | Working hypothesis | Next check |
|---|---|---|
| Strong near the address, progressively weaker at the edges | Geographic reach or stronger nearby competition | Inspect competitors and query relevance in the weak area |
| Weak throughout the grid, including the centre | Listing identity, relevance or wider competitive weakness | Confirm the correct profile and service query first |
| A weak pocket on one side only | A local competitor cluster or geography-specific demand | Compare the same coordinates across relevant queries |
| Abrupt worsening at previously stable points | A real change, measurement mismatch or temporary volatility | Reproduce the prior settings and verify profile changes |
One strong competitor at the edge does not prove “encroachment” over time. You need earlier comparable observations to establish that it gained ground. Without history, describe it as present competition, not a documented loss.
Step 3: Turn a Pattern Into a Prioritised Checklist
Verify Profile Accuracy and Categories
Compare the profile with the real business: location, name, operating hours and genuine services. Review whether the primary category fits the core activity and whether additional categories accurately describe other work.
Follow Google's business-representation rules. Do not add irrelevant categories, stuff location keywords into the business name or create a fake office to manufacture proximity. A weak grid does not justify risking the listing's eligibility.
Improve Legitimate Local Information
Ask whether the website clearly explains what is offered in the area being targeted. A useful local page should help a real customer assess service availability and contact the business; duplicating a thin page for every neighbourhood is not a substitute for that usefulness.
Prioritise practical problems: conflicting contact details, broken enquiry paths, vague services or outdated information. Do not infer that a particular landing-page change will fix a specific pin without testing the hypothesis.
Seek Genuine Reviews, Not Keyword Scripts
Ask actual customers for honest feedback without incentives or selective positive-review requests. Google's review policy prohibits fake engagement and incentivised contributions.
A customer may naturally mention a service or place, but do not dictate geo-keyword text or treat it as a guaranteed ranking lever. The objective is a truthful account of the customer experience.
Separate Implementation From Measurement
Assign each action an owner, rationale and verification method. Record when changes went live. Then rescan under comparable conditions after an appropriate observation interval; do not imply that the next scan proves causation by itself.
The agency proposal playbook helps translate that work into a defined engagement rather than a promise to turn the entire map green.
Present the Evidence Without Manufacturing Urgency
Use a short, specific explanation:
“This scan records visibility for this service query at these coordinates. You appear strongly near the business but less often in this neighbourhood. I would first verify the listing and compare the businesses shown there, then agree a limited improvement plan and measure again under the same setup.”
Do not turn a weak pin into an invented revenue-loss figure. A grid contains neither search volume nor conversion rate, and it cannot tell you that a dentist is losing a particular number of appointments.
A clear map can make the discussion easier to understand; it does not make closing effortless. Relevance, permission, budget, timing and confidence in delivery still determine whether a prospect wants your help.
For another view of the setup considerations, the ProfitMaps AI sister research hub is a useful companion. It is not Google's documentation or the vendor's official site.
Final Recommendation: Diagnose Before You Optimise
Start with one business question, an honest geographic boundary and consistent measurements. Use the grid to form a hypothesis, not to pronounce a penalty or promise a guaranteed fix.
ProfitMaps' prospective value is connecting that diagnosis with report and proposal preparation. Keep our provisional assessment in perspective and consult the main ProfitMaps AI review before selecting an entry licence or upgrade. Actual local SEO implementation remains your responsibility.
Frequently Asked Questions
Why does my Business Profile rank first at the office but disappear nearby?
Local results depend partly on the search location, alongside relevance and prominence. A search near the business therefore does not establish visibility throughout its service area. Use multiple relevant coordinates before deciding whether the pattern is normal competition, a coverage weakness or a change over time.
Is proximity decay an official Google penalty?
No published Google penalty or fixed formula with that name is established here. The phrase describes an observed geographical pattern, not proof of a violation. Check listing identity, query relevance, competitors and a consistent baseline before diagnosing a ranking problem.
Should I use a 5×5 or 7×7 grid in ProfitMaps AI?
The current vendor specification identifies Basic as 5×5 and Pro/bundles as 9×9; a 7×7 selector is not verified. Choose coverage around a real business question and confirm what the purchased plan actually supports. More points do not automatically improve the usefulness of a poorly designed audit.
Will ProfitMaps AI fix the weak grid points automatically?
A scan can help identify and explain a visibility pattern, but it does not establish automatic ranking fulfilment. Accurate profiles, useful local information, legitimate reviews and appropriate implementation still matter. Measure subsequent changes without guaranteeing rankings or attributing every movement to one action.