
Quick answer: ProfitMaps AI is a potential low-entry-cost prospecting workspace, not yet an established replacement for every recurring rank tracker. Keep your current reporting system until you have confirmed its replacement can reproduce your actual scan workload, report history and client delivery. Our provisional 7.6/10 documentation-based workflow assessment is unchanged; it is not a three-product accuracy benchmark.
Subscription Fatigue: Audit the Workload, Not Just the Invoice
A $99 monthly line item feels expensive when you use it for two sales calls. It can be inexpensive when it supports dozens of retained clients. The mistake is comparing a software licence with a monitoring service as though they purchase identical capacity.
Also, recurring geo-grid tools do not universally start at $99. At our October 16 pricing check, Local Falcon Starter was $24.99 monthly. BrightLocal Track for one location was $41 monthly or $369 billed annually. These are reference configurations, not a quotation for every agency.
Before cancelling anything, list what the subscription actually delivers: recurring scans, retained historical reports, exports, branded presentation, integrations and support. Mark features you used in the last month. A replacement should remove a real cost without quietly transferring the same work to your team.
For the product's broader scope and evidence boundaries, start with our full ProfitMaps AI review. This article concentrates on the subscription-replacement decision rather than repeating its feature catalogue.
Side-by-Side Comparison Matrix
The table separates seller documentation from tested operating performance. Prices and terms were checked on October 16, 2026; taxes, additional usage and later changes can alter the total.
| Decision factor | ProfitMaps AI | Local Falcon | BrightLocal |
|---|---|---|---|
| Entry reference | $37 advertised Basic; one-time plan billing described in seller terms, not a verified live checkout | Starter $24.99/month; $299.88 annual package | Track, one location: $41/month or $369 billed annually |
| Grid coverage | Basic 5×5; current vendor page lists 9×9 for Pro and bundles | Published sizes range from 3×3 to 21×21 | Configurable Local Search Grid; verify current grid-size and plan settings |
| Usage planning | Demo previews scan cost; included credits, replenishment and full metering remain checks | Starter lists 7,500 monthly credits; one map point uses one credit | Grid credits depend on report settings, keywords and frequency; confirm your allocation |
| Client reporting | Vendor demonstrates report settings; attribution removal is shown as Pro functionality | PDF/CSV exports and reporting tools documented; check exact tier for branding and integrations | White-label reporting documented; confirm your plan and desired report type |
| Prospecting fit | Connected audit, business and website pitch; Business Finder is a separate offer | Also documents sales-enablement functionality; not tracking-only | Agency lead-generation tooling is listed; not reporting-only |
| Twelve-month budgeting | $37 entry plus any upgrades, data, credits and other costs; annual total not established | $299.88 for the displayed Starter annual package, before extras | $369 for the displayed one-location annual Track package, before extras |
Pricing references: Local Falcon official pricing and BrightLocal official pricing, checked October 16. Competitor purchase destinations are intentionally not linked here. Informational references below explain workflow rather than direct you to a competing checkout.
Do Not Import One Tool's Credit Model Into Another
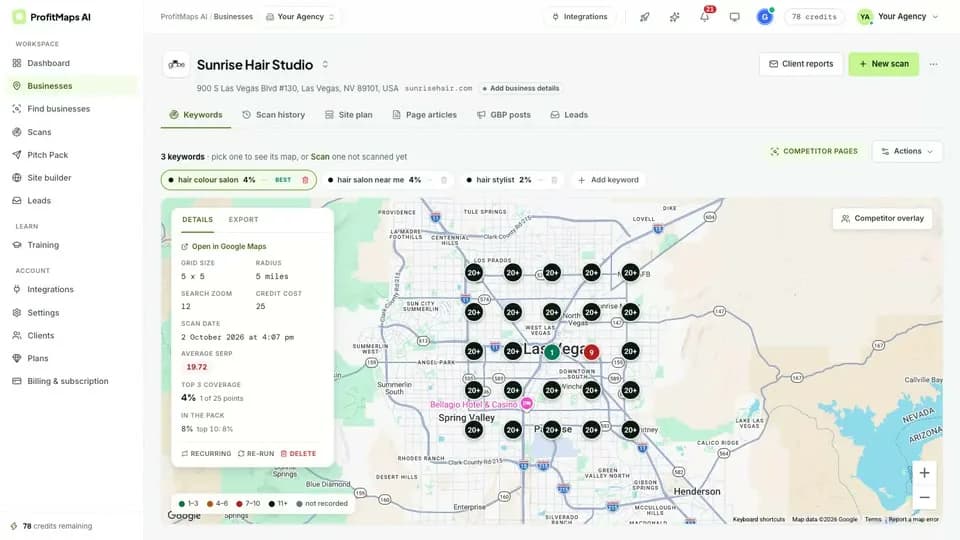
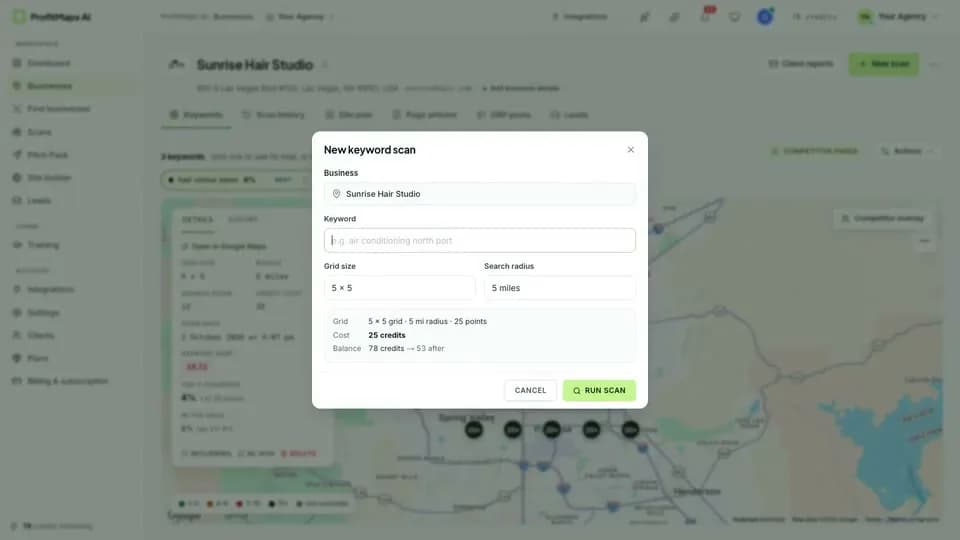
Twenty-five grid positions do not automatically mean identical billing across all products. A tool may meter data points, analysis, generation, exports or externally supplied data differently.
Use the neutral workload formula locations × keywords × positions × scan runs to estimate observation volume. Then apply each seller's actual meter. For example, five locations, two keywords, 25 positions and four runs require 1,000 observations. That is a workload calculation, not proof that ProfitMaps charges exactly 1,000 credits.
Treat failed scans, retries, competitor scans and optional AI analysis as separate questions. A cheaper licence can be more expensive per usable report if routine corrections consume additional resources.
Where Established Tracking Platforms Have the Stronger Documented Case
Historical Reporting and Repeatability
A sales audit answers, “What appears to be happening now?” A retained-client report answers, “What changed under a consistent measurement method?” Those jobs overlap, but they are not interchangeable.
Local Falcon documents recurring campaigns and historical reporting. Its scan-settings guide discusses scheduling and the budget implications of scan frequency. Daily scans exist, but they are not automatically necessary for every client.
BrightLocal's report setup documentation describes ad hoc, weekly and monthly options in that documented interface. Do not confuse its separate rank-tracker settings with a promise of daily geo-grid runs on every plan.
Before switching, verify history retention, comparable scan settings, exports and what happens to old reports after cancellation. Screenshots in a sales presentation do not answer those operational questions.
Integrations and Multiple Locations
An agency delivering a dashboard to 80 branches needs more than a compelling heatmap. It needs permissions, usable exports, consistent identifiers and a reliable way to combine results.
API access, webhook-style notifications and automated report delivery should be checked individually. They are not all the same capability, and an integration logo is not an entitlement list. Neither competitor's entry price establishes that every integration is included.
ProfitMaps may suit a smaller initial roster, but its advertised Basic customer and keyword caps should be mapped against your actual contracts before you consider migrating recurring reporting.
Where ProfitMaps AI Could Be the Better-Fit Purchase
The clearest prospective advantage is the connected commercial workflow: use a local visibility observation to open a specific conversation, then prepare a relevant report or website proposal. That can be attractive to a freelancer whose present bottleneck is qualifying opportunities rather than monitoring hundreds of existing locations.
This is a workflow-fit inference, not a measured claim that it closes prospects faster. A client can understand the report and still decline the service. The software does not establish your fulfilment skill, proposal quality or the prospect's budget.
Nor should “one-time payment” become “zero ongoing overhead.” The seller's payment terms describe plans as one-time purchases and upgrades or extra credits as separate. Data costs, staff time and other tools remain part of agency economics.
The dedicated ProfitMaps AI research site provides a separate reference for the documented workspace and setup considerations. It is our sister property, not the seller's official documentation or an independent second test.
For an implementation-neutral measurement method, use our Google Maps grid audit framework. For turning observations into a properly scoped proposal, use the local SEO retainer playbook.
A Practical Switch-or-Keep Decision
Do a small parallel evaluation rather than a full migration:
- Freeze the measurement brief. Use the same listing, query, coordinates, coverage and time window where supported.
- Check the outputs manually. Verify the listing identity and selected locations; investigate material differences instead of declaring one tool more accurate from a green grid.
- Measure report preparation effort. Count explanation, correction and export time, not just time until a scan starts.
- Price your real workload. Include replacement credits, required upgrades and the cost of retaining or exporting historical reports.
- Decide by function. Keep an established tracker for ongoing monitoring if needed; consider ProfitMaps for a separate prospecting workflow only when the combined stack earns its place.
A hypothetical $100 monthly saving is irrelevant if the switch adds five hours of manual reporting. Conversely, a modest extra licence can be worthwhile if it reliably fills an otherwise missing proposal step. Validate the difference in your own process rather than borrowing a seller's projected return.
Final Verdict: Replace a Function, Not a Brand
Keep Local Falcon or BrightLocal when existing client delivery depends on their recurring measurement, historical reports or a verified integration. Shortlist ProfitMaps AI when you want to evaluate a connected audit-to-proposal workflow at a relatively small advertised entry price.
Use both only when their roles are distinct. Buying overlapping dashboards without retiring manual work does not improve margin. The right choice is the lowest total cost for an adequate, repeatable service—not necessarily the lowest sticker price.
Check the current offer against our main ProfitMaps AI assessment before making that decision. The advertised October 21 release is still in the future as this guide is written; it is not proof of an open cart today.
Frequently Asked Questions
Can ProfitMaps AI replace Local Falcon or BrightLocal completely?
Not on the evidence currently available. Confirm recurring scan control, report history, export rights, usage costs and the integrations your clients depend on before replacing an established service. ProfitMaps is more reasonably evaluated first as a prospecting and proposal workflow.
Is the $37 ProfitMaps AI offer really a one-time purchase?
The advertised entry price is $37, and the seller's public terms describe plan payments as one-time. A live checkout total has not been confirmed for this guide, and extra credits or upgrades are separate. Confirm the selected offer's final billing before paying.
Which option is cheapest over a full year?
The displayed reference annual packages are $299.88 for Local Falcon Starter and $369 for BrightLocal Track at one location. ProfitMaps' full-year operating cost is not established by its $37 entry alone. Compare equivalent workload, optional tools and additional usage rather than declaring a universal annual winner.
Does a larger grid automatically produce a more accurate audit?
No: more positions increase sampling density or coverage, depending on the settings. A poorly centred large grid can still answer the wrong business question, and changing its coverage makes comparisons harder. Choose coordinates around the actual market, record the setup and use consistent scans over time.