
Evidence note: this is a fictional worked example, not a client case study or a timed product test. The clinic, review count and ranking values below are invented solely to explain interpretation. Vendor screenshots illustrate the actual documented interface; they are not captures of this clinic or evidence that we ran its scan in five minutes.
Our provisional 7.6/10 documentation-based ProfitMaps AI assessment remains unchanged. The vendor advertises October 21, 2026 at 11 AM EDT and $37 Basic entry, with a published 30-day money-back policy. Those facts do not establish an open checkout, operational scan speed or successful patient acquisition today.
Disclosure: purchase links may earn us a commission at no extra cost to you. We own the sister research publication linked below; it is not an independent second test or official seller documentation.
Why a Clinic Example Needs More Care Than a Revenue Pitch
Dental and aesthetic practices can have meaningful local demand, but they are not automatically the best buyers for every freelancer. Service mix, capacity, geography, reputation and marketing restrictions vary. A universal $2,000 patient lifetime value is not established by a map or a tool licence.
Start with the business question: which actual service, offered by this practice, should a nearby searcher be able to find? Do not use a specialist procedure solely because it sounds valuable. The practice should approve service descriptions and any clinical or advertising claims; a marketing audit is not healthcare advice.
Read our full ProfitMaps AI review for the demonstrated software workflow. This article teaches an audit conversation, not a generic feature tour or a claim that one clinic account pays for a software stack for years.
Define Two Separate Research Briefs
For a dental brief, an agreed query might concern clear-aligner consultation, but only if the practice actually provides it. For a MedSpa brief, select a relevant service or a broader clinic search. Do not combine the results into one competitive map: the intent and eligible competitors can differ.
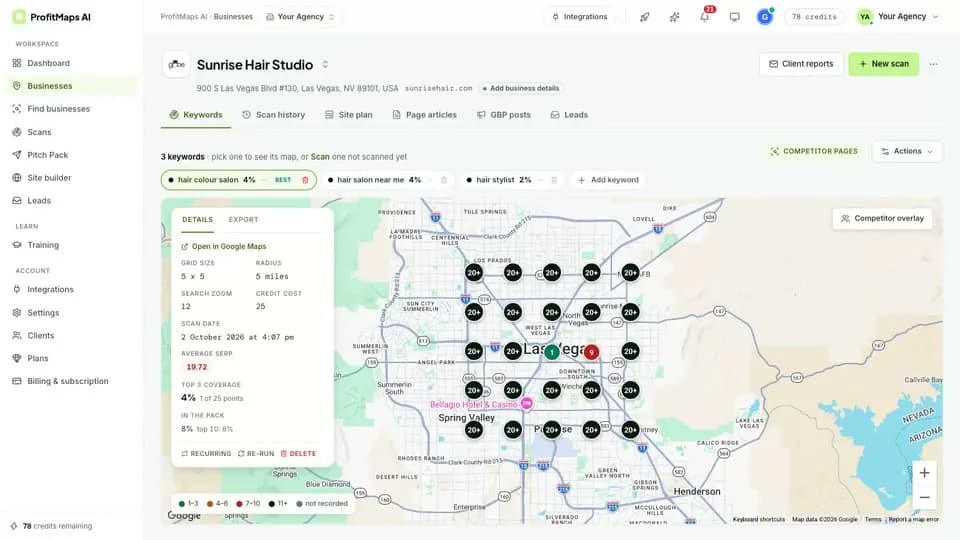
Record one actual listing identity, exact query, map center, supported grid size, coverage, collection date and result depth for each brief. Use a geography that matches the client's real service market rather than a dramatic radius chosen to maximize red points. The grid audit framework provides the measurement checklist.
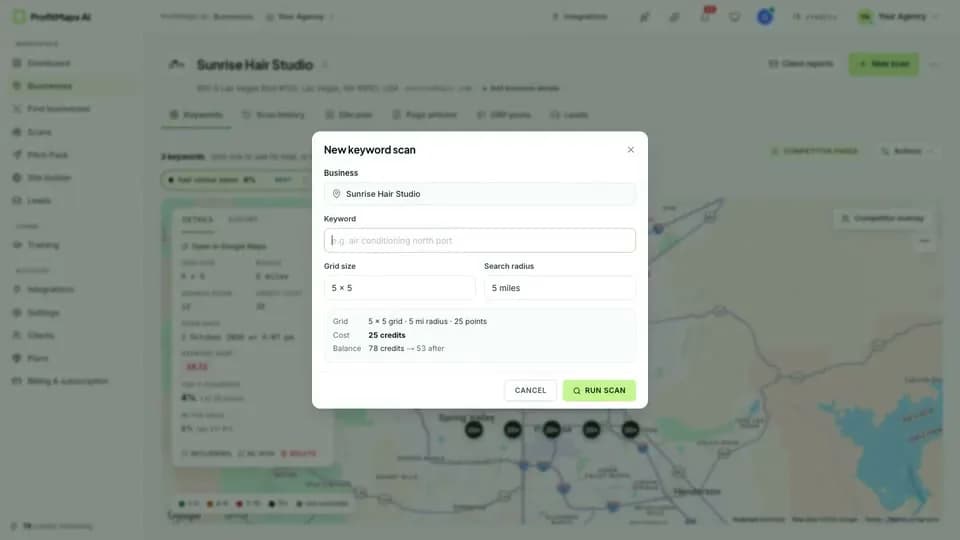
The current vendor page lists 5×5 Basic and 9×9 for Pro and bundles. A five-mile radius is an example planning choice, not a confirmed mandatory setting or a guarantee that every plan supports every layout. Confirm the actual available settings before offering the report commercially.
The Fictional Observation: Strong at the Building, Weaker North
Imagine an established fictional clinic with 140 reviews. In our invented teaching dataset it appears at position 2 near the building and position 14 at a sampled point roughly two miles north. These figures are not collected data, not a vendor accuracy claim and not evidence of an actual clinic's performance.
| Fictional observation | What it suggests checking | What it cannot establish |
|---|---|---|
| Position 2 near the building | Local relevance and listing identity | Dominance throughout the whole market |
| Position 14 at a northern point | Distance and local competition | A missing category as the proven cause |
| 140 reviews | Review content, recency and genuine reputation | Guaranteed visibility or patient value |
| A competitor appears more often | Relevant service and listing differences | Keyword stuffing or misconduct |
A review count alone does not explain the pattern. The clinic may be farther from the northern point than competing practices, or the exact query may match another service more closely. There may also be an inaccurate listing match or a collection limitation. Investigate before prescribing changes.
The proximity-decay guide is the appropriate companion for the center-versus-edge pattern. A red map is a prompt for questions, not a license to frighten the owner with a fabricated diagnosis.
Separate Observations, Hypotheses and Recommendations
An observation is a documented result under stated conditions. A hypothesis is an explanation worth checking. A recommendation is an action justified after further evidence and approval. Keeping those layers separate is what makes the report useful.
For example, check whether the chosen primary category accurately represents the practice. A missing relevant secondary category might be a hypothesis, but the grid cannot prove it caused the lower position. Compare the actual services and applicable profile guidance before proposing any edit.
Do not accuse a competing practice of keyword stuffing because it ranks well or has a longer name. If there is a genuine apparent policy issue, document it carefully and use the legitimate platform process; do not promise that a complaint will remove a competitor or improve your client's ranking.
The post-scan optimization checklist provides a policy-aware priority framework. The right first action may be correcting a clear factual problem, changing the measurement brief or concluding that distance limits the opportunity.
Prepare a Client Brief Without Inventing Missed Patient Revenue
A useful report begins with the business question, method and date, then shows the geographic pattern and its limitations. Include only recommendations you can explain and scope. Export a PDF or branded document only if the selected plan grants the required capability; a Pro settings screen does not prove Basic white-label rights.
Do not turn a rank into an exact number of missed patients. That would require reliable evidence about query demand, result exposure, clicks, inquiries, appointment conversion, capacity and value. Even a financial scenario needs explicit assumptions and must not be presented as observed loss.
For an appropriate meeting, say: “This snapshot suggests a difference across these sampled locations. We should validate the service query and investigate the strongest explanations before agreeing any implementation.” That statement is less dramatic than a revenue alarm and more defensible.
Our ninety-second outreach guide shows how to explain one qualified finding. It does not establish a forty-percent reply rate or permission to send repeated unsolicited messages to clinics.
Design the Follow-Up Before Starting the Work
Keep the baseline settings and record approved changes. Agree a follow-up cadence and identify external factors that can complicate comparison. A thirty-day review may be operationally convenient, but it is not a deadline by which a particular ranking improvement must occur.
For teaching only, suppose a 25-point grid initially has eight top-three positions: 32% sampled coverage. If a later comparable scan has ten, that is 40%, an eight-percentage-point increase. Those invented values illustrate arithmetic, not ProfitMaps results, a clinical client story or causal proof of an intervention.
Assess business outcomes separately using an approved, privacy-conscious method. Do not collect patient histories, appointment details or identifiable review material just to enrich an SEO deck. The visibility provider usually needs aggregate agreed indicators, not clinical records.
The Commercial Decision: Scope Before a Retainer
A practice may want a one-off explanation, implementation by an existing provider or no engagement. Fit the proposal to that choice rather than assuming every clinic should buy a monthly package. The retainer playbook separates a defined service from a promise of patient growth.
The ProfitMaps AI sister research hub provides additional context on the documented workspace, not proof that this example happened. Use the scan-cost guide to estimate workload before quoting repeated monitoring.
Revisit our main ProfitMaps assessment before buying. Verify the actual order, credits, report rights and seller guarantee terms. The reason to shortlist the software is a potentially useful diagnostic and proposal workflow—not an invented five-minute audit or a guaranteed high-value client.
Sources checked October 19, 2026: official vendor launch specifications and seller refund policy. Release and prices remain advertised rather than checkout-confirmed; product documentation does not establish our hands-on results.
Frequently Asked Questions
Is this a real ProfitMaps AI clinic case study?
No. It is an explicitly fictional worked example using invented clinic and ranking figures. The vendor images show documented interface examples, not this clinic, our scan results or a completed customer engagement.
Does a position drop prove the category is wrong?
No. Distance, query relevance, competitors, listing identity and collection conditions can all require investigation. Treat a possible category mismatch as a hypothesis to verify against the real business, not a diagnosis supplied by a red point.
Can I calculate exact lost patients from the heatmap?
Not from the heatmap alone. Demand, exposure, clicks, inquiries, appointment conversion and value need separate evidence. Keep financial scenarios explicitly hypothetical and avoid using clinical or patient data that the audit does not need.
Was the audit completed in five minutes?
No timed scan was performed for this article. Vendor walkthroughs may edit out waiting time, and a proper audit includes verification and explanation as well as collection. Do not promise a delivery time before testing your actual authorized workflow.